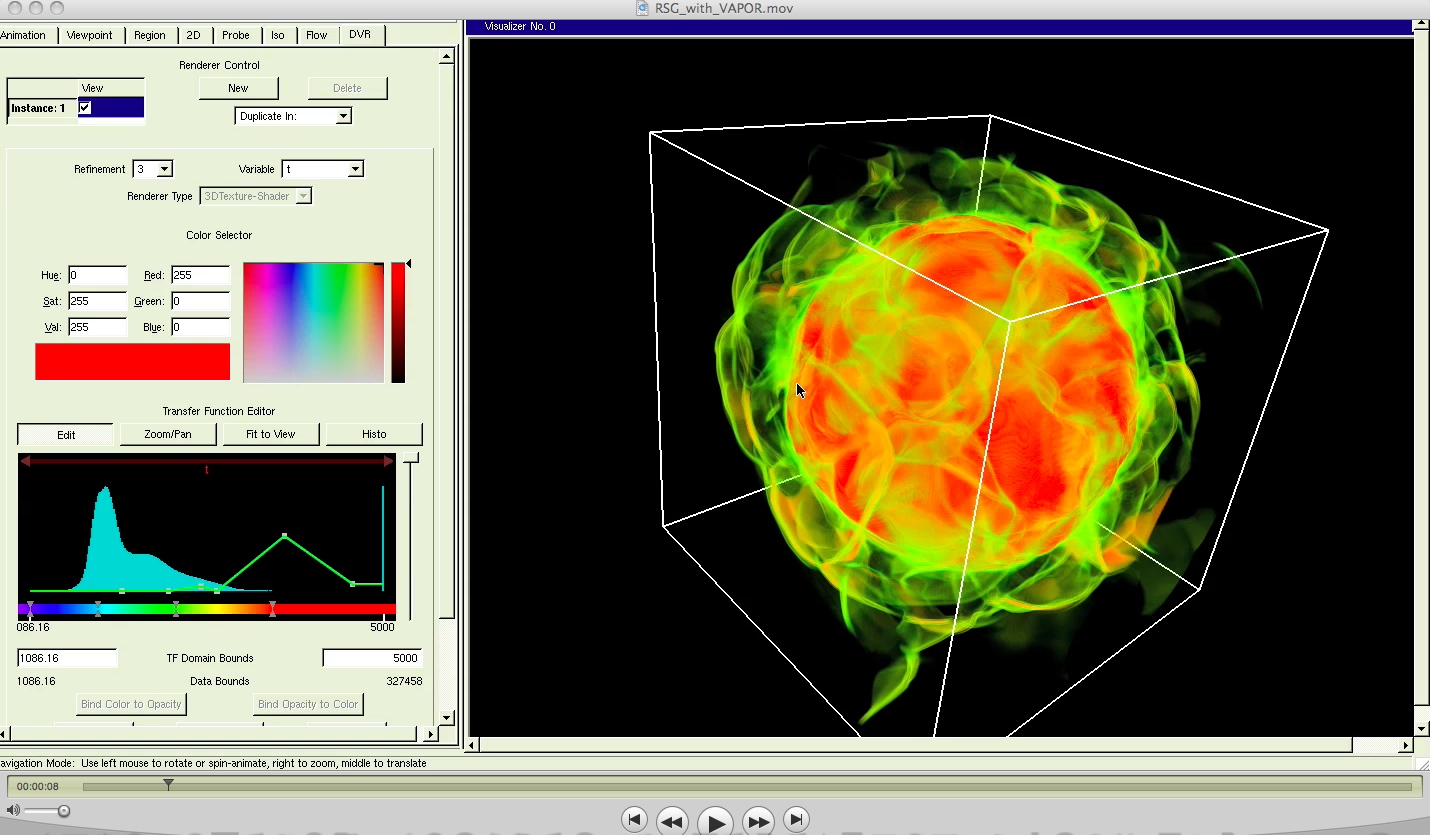
Computation of 3D simulations of cool stars with CO5BOLD (Freytag et al. 2012, Journal of Computational Physics, 231) for star-in-a-box model (global model) and with Stagger-code (Nordlund, Stein et Asplund, Living Reviews in Solar Physics 2009, vol. 6, no. 2) for box-in-a-star (local model).
New generation of Red Supergiant simualtions to unveil the mass-loss mechanism
High numerical resolution / non-grey / grid of new stellar paramters
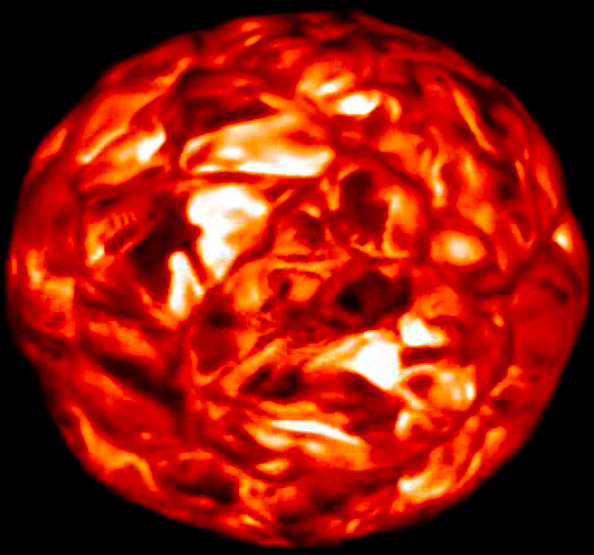
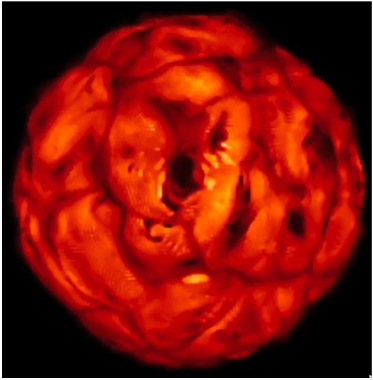
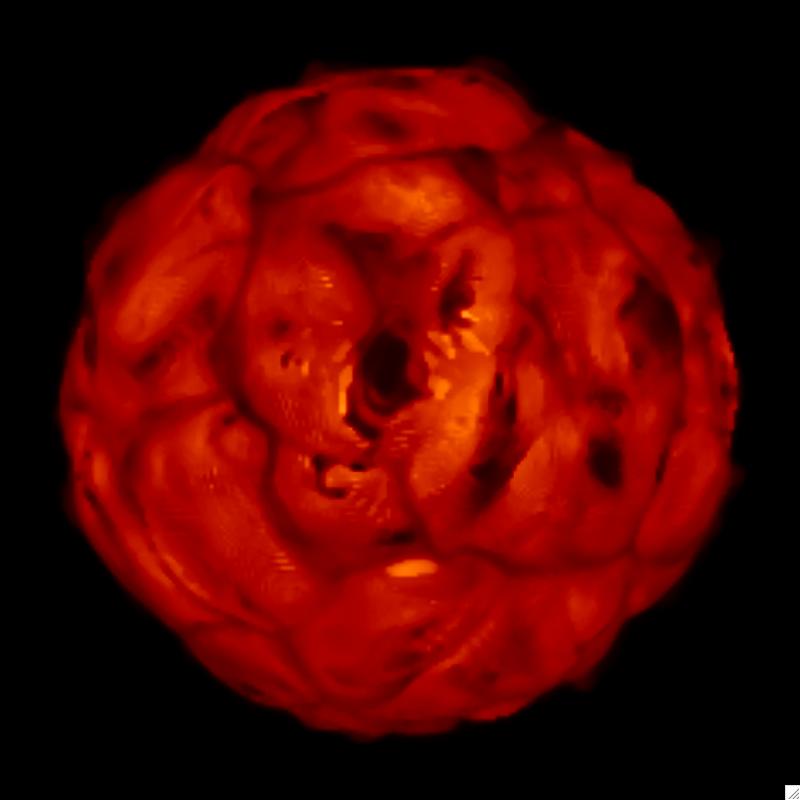
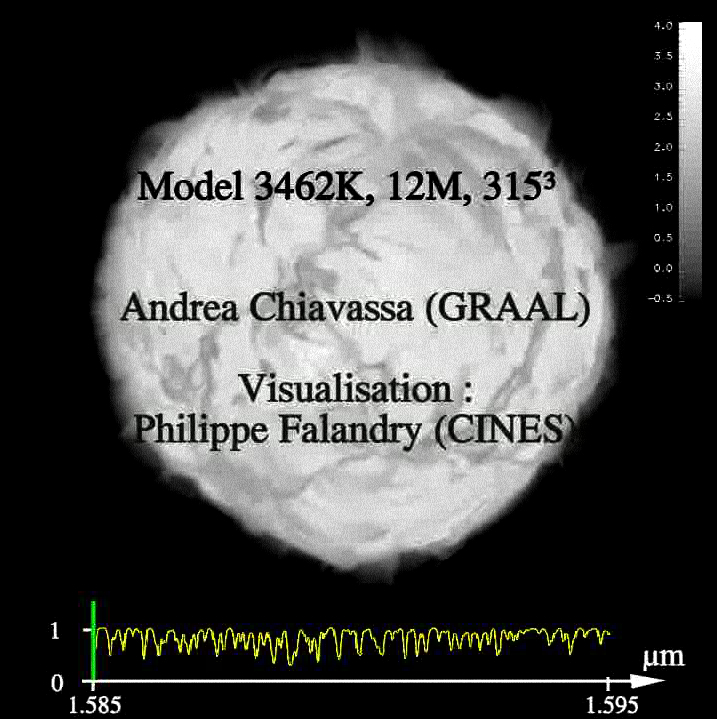
Click on the image to see a movie of the bolometric emerging intensity of the highest resolution simulation. Chiavassa, Freytag, Masseron & Plez 2011, A&A (ADS link)
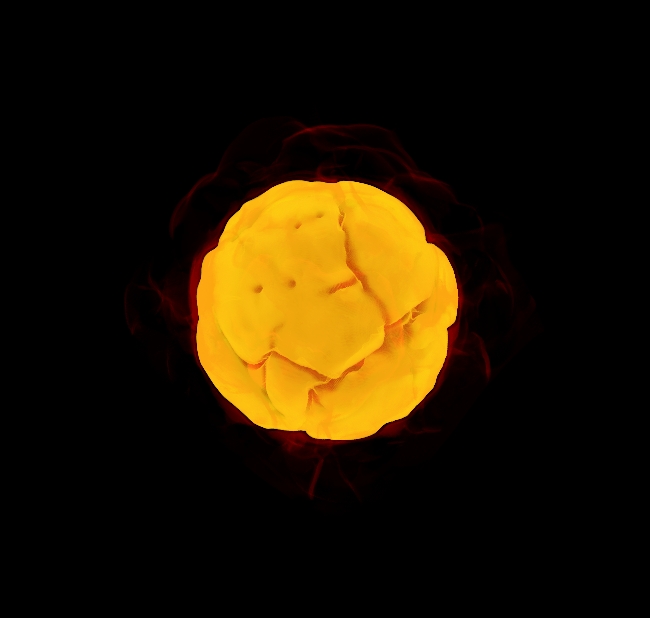
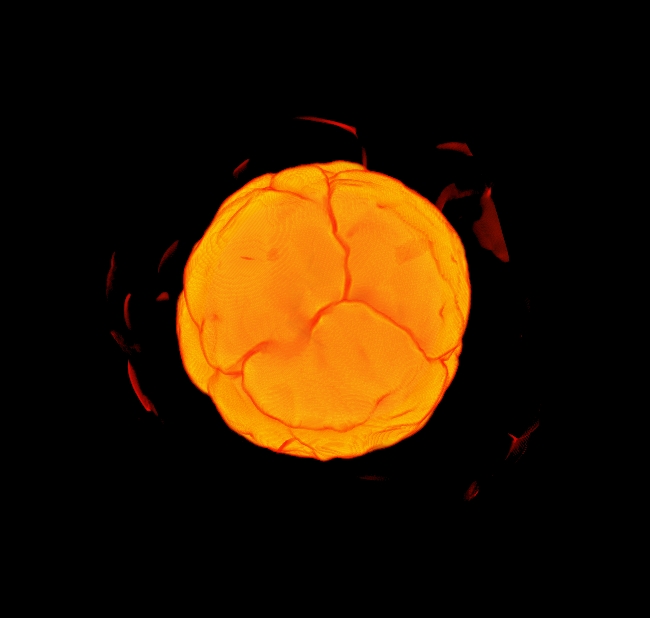
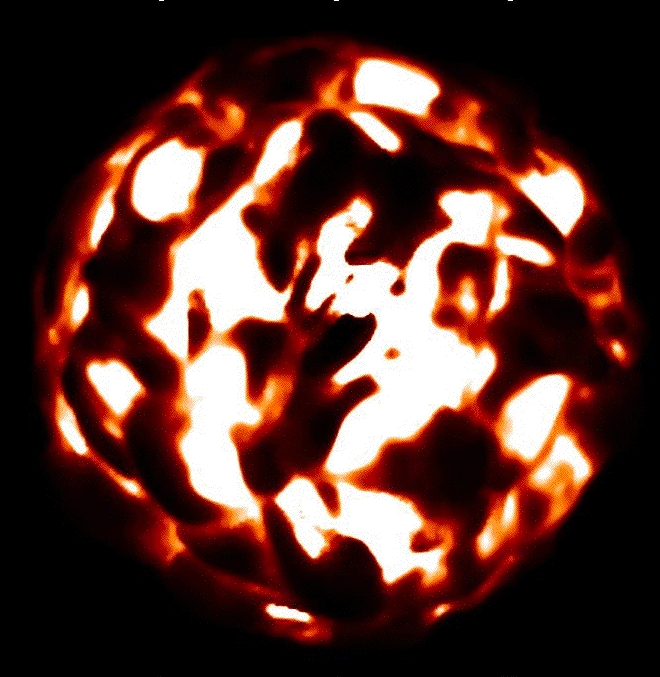
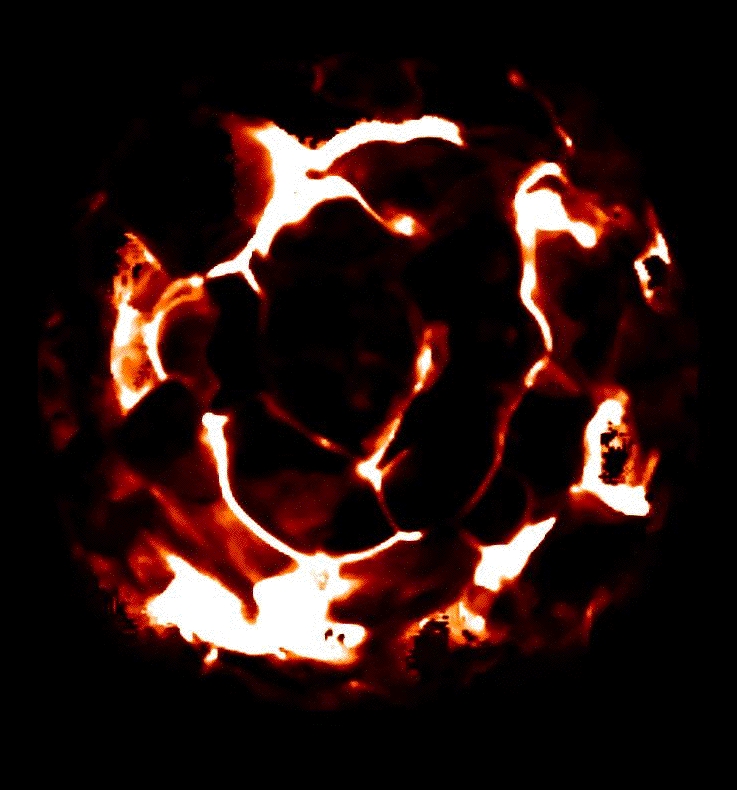
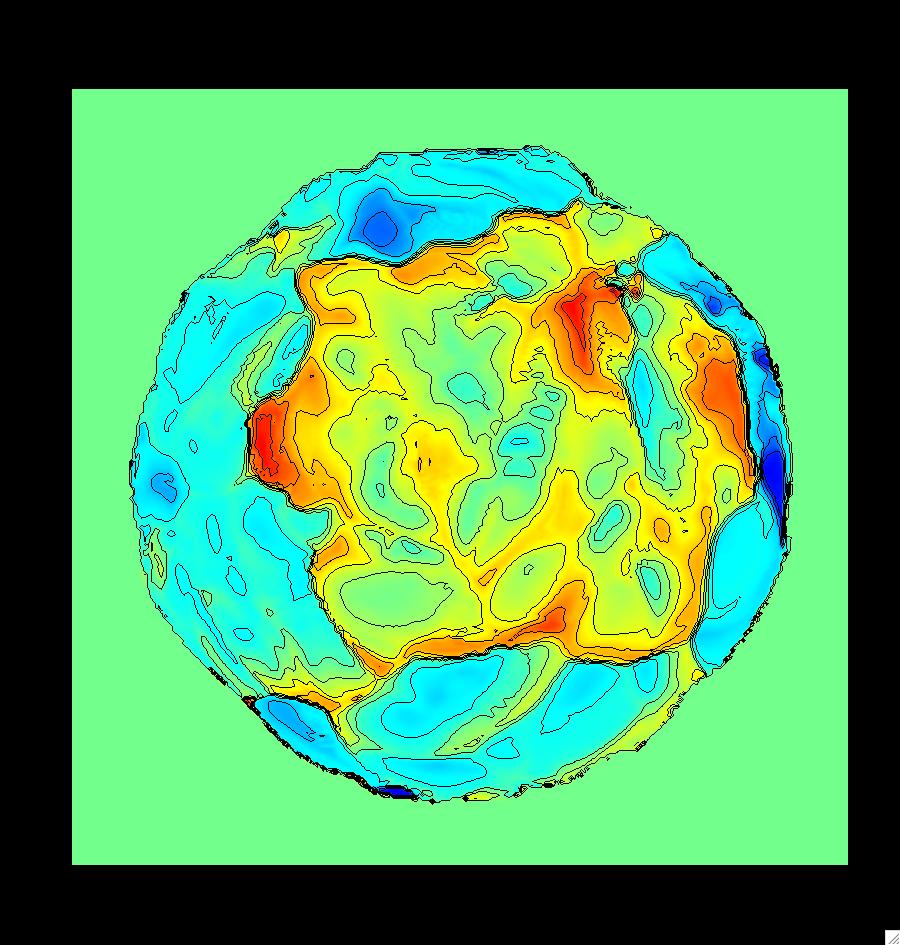
Voyage over the surface of a supergiant. Click on the images to start the videos !!!!!!
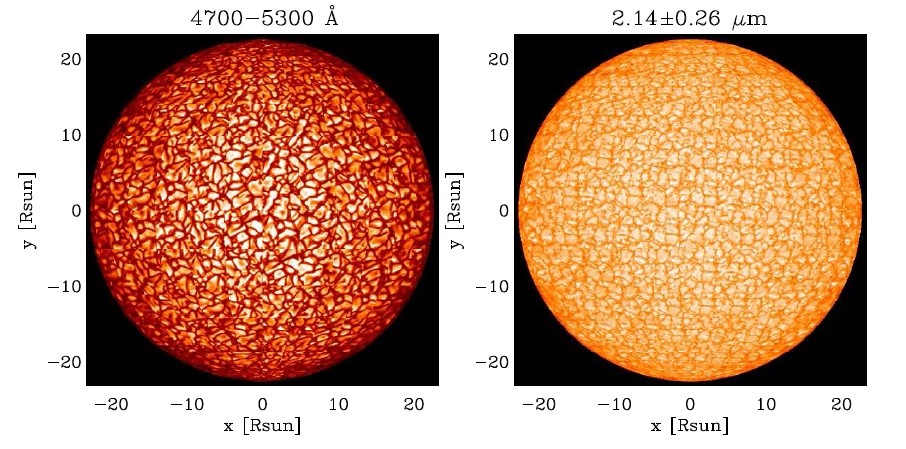
3D Radiative Transfer code OPTIM3D (Chiavassa et al. 2009, A&A, ADS link) using three dimensional simulations in the star-in-a-box configuration (CO5BOLD) as input:
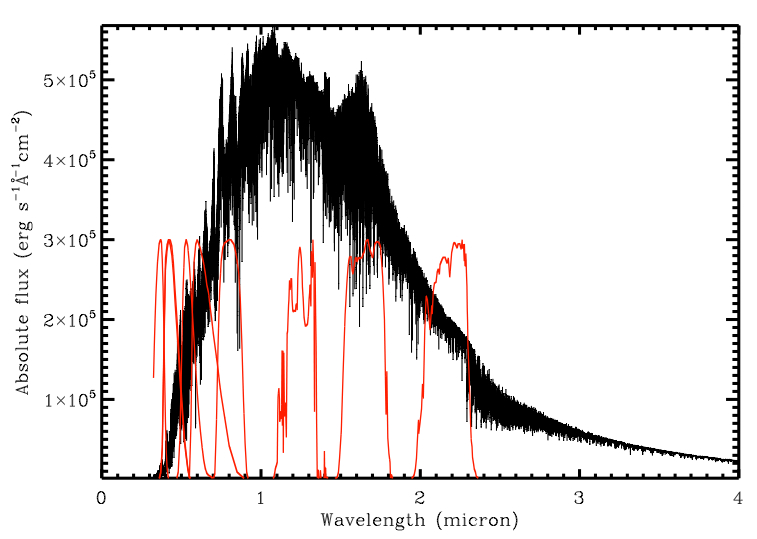
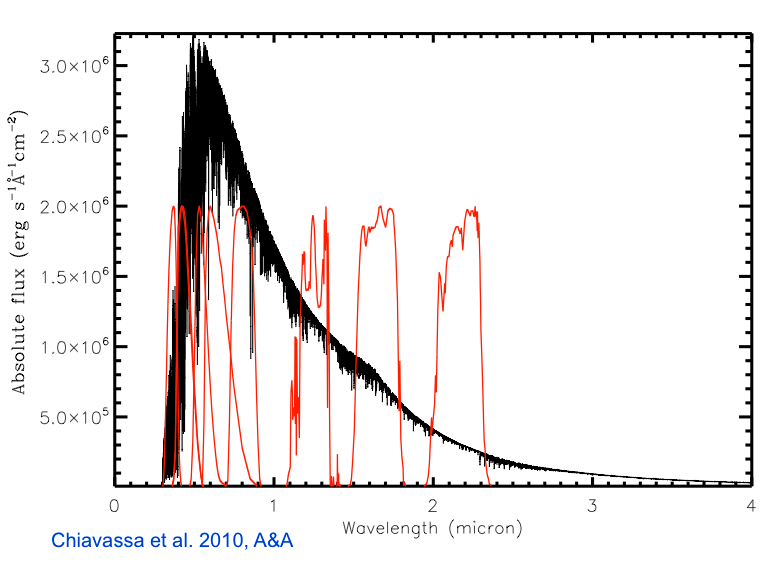
1) spectral synthesis --> to constrain the atmospheric dynamics, photometry, stellar parameters, abundances
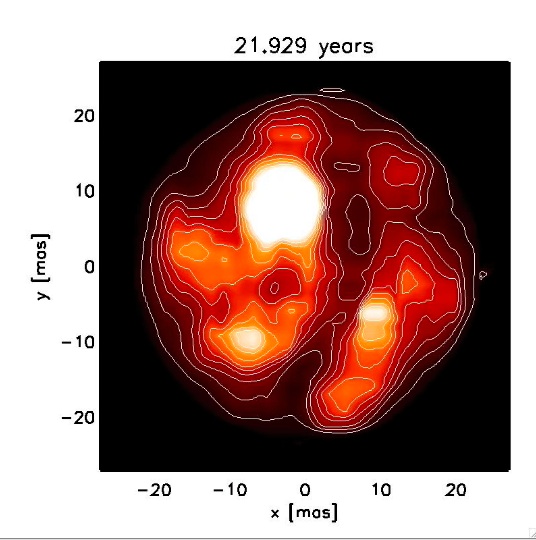
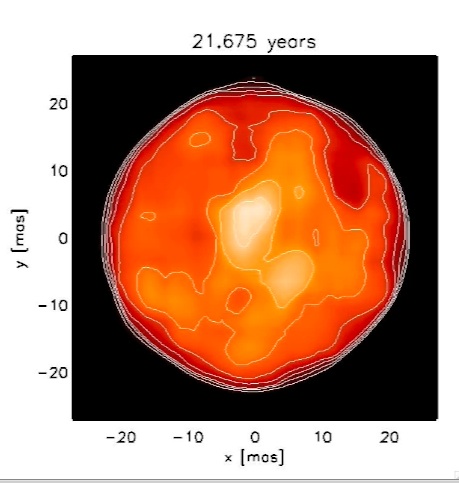
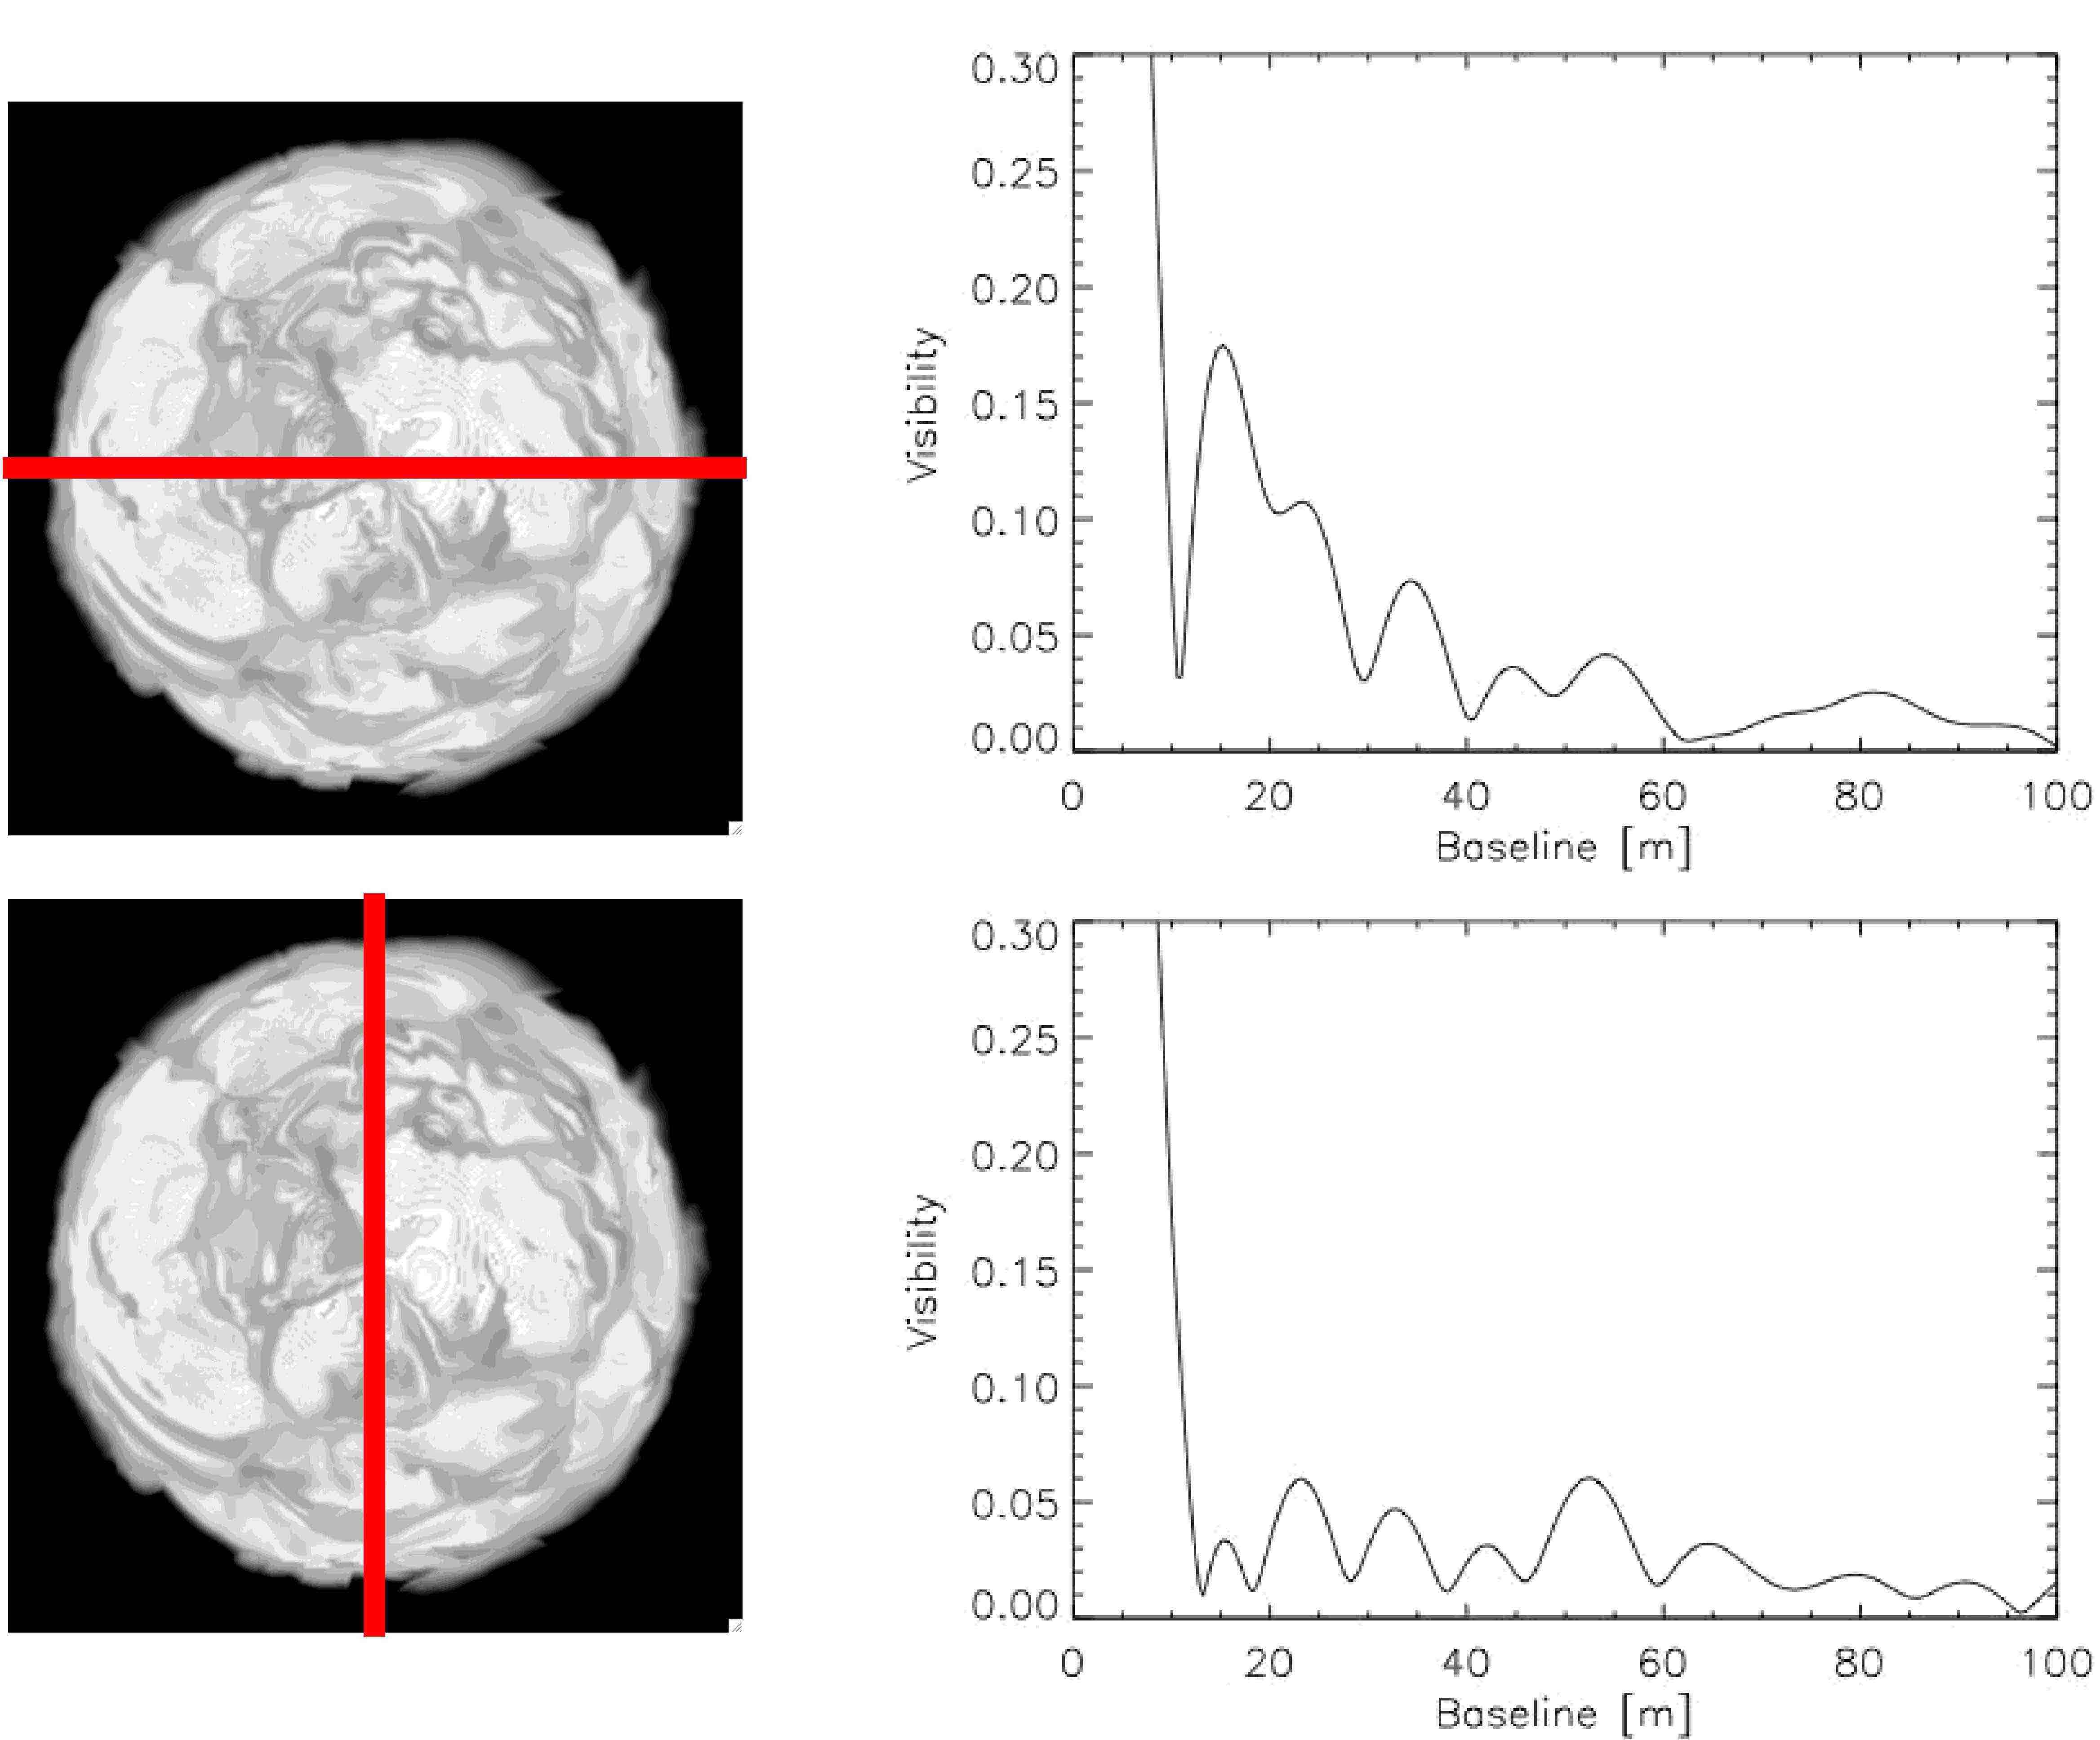
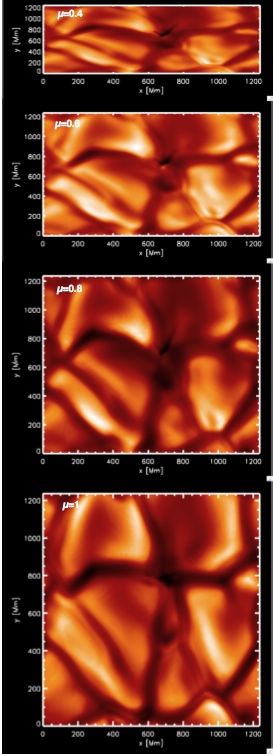
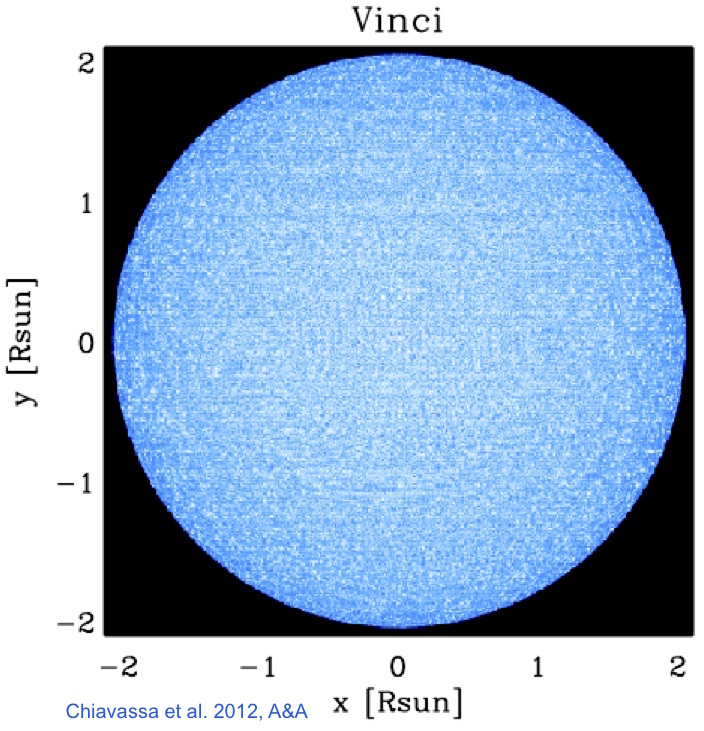
2) intensity maps --> to constrain the granulation structure size, the limb darkening, the characterization of the hosted planets
 |
 |
 |
 |
 |
 |
 |
 |
 |
 |
Data redution with VLTI-AMBER Measurement and characterization of the convective pattern (granule size, surface contrast, timescales) of red supergiant stars, K giants, sub-giants and solar type stars. Image reconstruction |
3D Radiative Transfer code OPTIM3D (Chiavassa et al. 2009, A&A, ADS link) using three dimensional simulations in the box-in-a-star configuration (Stagger-code, Nordlund, Stein et Asplund, Living Reviews in Solar Physics 2009, vol. 6, no. 2) as input:
 |
 |
 |
 |